Trade Summary: Key Data Points
The Dhaka Stock Exchange is open from 10:00 am to 2:20 pm on Sunday through Thursday. Millions of trades occur over the course of the 4 hours and 20 minutes that the market is open. Consider a single share of stock. A trade is completed on the exchange every minute. Is it necessary for us to keep track of every single price point at which a trade is executed as market participants? Let's use this hypothetical stock with numerous trades as an additional example to further demonstrate this. Take a look at the image below. Each point denotes the execution of a trade at that specific moment.

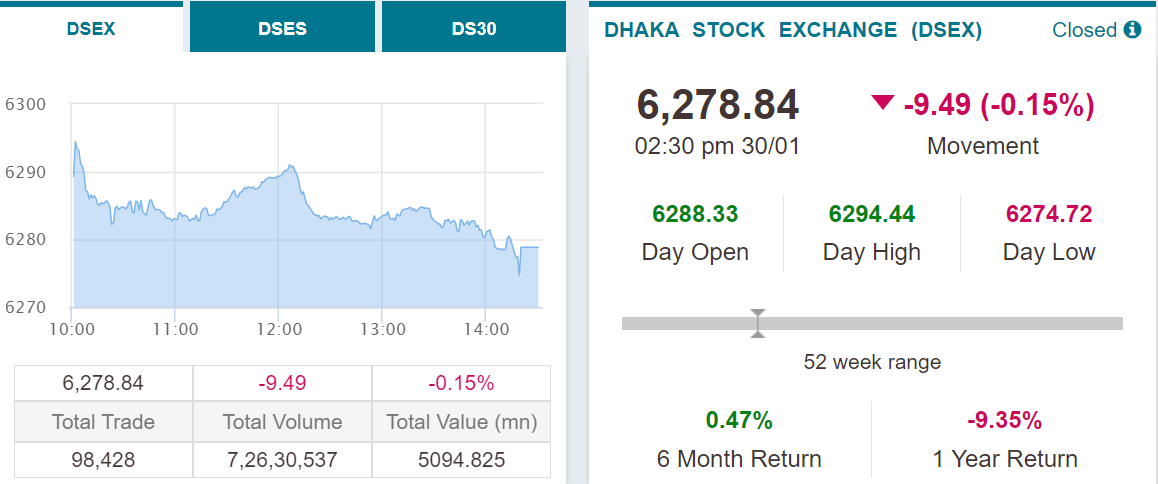
As an investor, what you really need is an overview of the trading activity rather than specifics on all the different price points. Thus, by observing the Open, High, Low, and Close, we can analyze the price action.
•The open – When the markets open for trading, the first price at which a trade executes is called the opening Price.
•The high – This represents the highest price at which the market participants were willing to transact for the given day.
•The low – This represents the lowest level at which the market participants were willing to transact for the given day.
•The close – The Close price is the most important price because it is the final price at which the market closed for a particular period of time. The close serves as an indicator for the intraday strength. If the close is higher than the open, then it is considered a positive day else negative. The closing price also shows the market sentiment and serves as a reference point for the next day’s trading. For these reasons, closing price is more important than the Open, High or Low prices. The open, high, low, close prices are the main data points from the technical analysis perspective. Each of these prices have to be plotted on the chart and analyzed.